What is Splunk?
Splunk prides itself on “disrupting the conventional ways people look at and use data”, which is exciting. So what is Splunk?
Splunk is a horizontal technology used for application management, security and compliance, as well as business and web analytics. Splunk has over 5,200 licensed customers in 74 countries, including more than half of the Fortune 100. – Wikipedia 2013
I found (and you’ll find to) that Splunk the technology applies to almost every industry- government, online services, education, financial, healthcare, retail, telecommunications (and more) so having Splunk experience as part of your repertoire will be relevant for a long time to come. So why am I excited about Splunk? What can a TM1 guy do with it? Well, using Splunk, you can create simple to robust custom real-time (and near real-time) web-style applications for:
- searching,
- monitoring, and
- analyzing
your data. It turns out that what Splunk apps are particularly useful for is dealing with transactional data – logged transactions that are machine or (in TM1’s case) application generated. Who hasn’t had the mundane task of pouring through literally thousands and thousands of TM1 transactions looking for the specific occurrence or a particular value such as an individual client ID or error code?
How complicated would it be to jump into Splunk and use it for some TM1 transactional analysis? Let’s see:
First, I have to say that when I first got started using Splunk, I found that the “ramp-up” time for this product is short allowing you to be productive quickly. The Splunk interface is web-based (which means that no client needs to be installed on your machine) so once you download the package (and there is a free version), it’s easy to install and setup (actually, no real “setup” is required if you just want to use the native power of Splunk to do some searching through your TM1 logs!).
After you sign-in, Splunk will show you its “home app” (the Splunk home app is the launching pad for all applications and “out-of-the-box” tutorials). To “jump right in”, you can click on the “Add data” button.
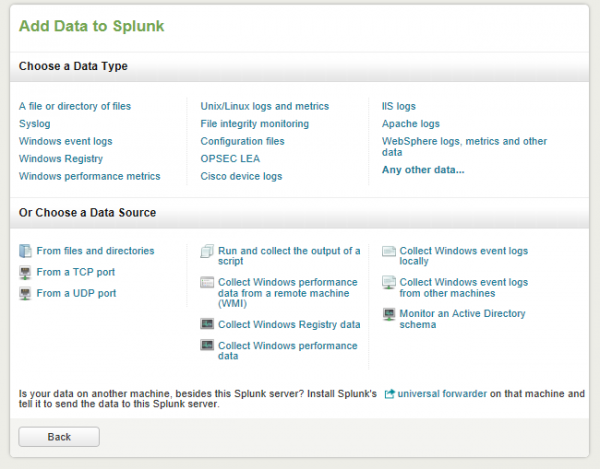
Since this is the first “Splunk voyage”, (using TM1 data), you can click on the “file or directory of files” link to choose a data type rather than a data source. From there, you can browse and select the file you want to “read into” Splunk (in this case the tm1s.log file that my server is using). Since this Splunk server has not dealt with TM1 logs before it asked me if I’d like to “start a new source” or “apply an existing one” so I went ahead and created a source named “tm1server.log”. Once I did that, Splunk went ahead and “previewed” my file for me.
In the documentation, you’ll read that the “Splunk’ data preview feature offers a powerful way to improve “event processing”. Event processing is actually Splunk referring to the events (or log transactions) in the file you’ve read in.
What Splunk does is create an index of the data so that you can perform analysis on it easily and quickly.
During the preview, Splunk “performs a partial” (runs a subset of the data) and then reveals the expected results. You can use this information to make sure that Splunk will index your data exactly as you want it to appear, for the intended purpose you have in mind. Unlike normal indexing, the preview process does not commit the resulting events to an index allowing you to adjust and improve the indexing process interactively, so, when Splunk later performs the actual indexing, your event data ends up in Splunk formatted exactly as you want it to be.

After the preview screen is accepted (by clicking continue) Splunk asks you to set 2 parameters for the data source.
- What will be ongoing source of this data (I choose index from file or directly)
- What is the full location path of the data (in my case it is the path to the TM1 server log I want to monitor)

After verifying my settings and clicking on Save, Splunk asks if I want to “Get started searching” or “Add more data to Splunk”.
Searching
Searching is where it all happens in Splunk. To start, Splunk presents you with the summary view page. The summary page contains all of the information about the users default searches and is comprised of 4 “panels”:
All indexed data panel
The All indexed data panel shows statistics for all Splunk indexed data (total events indexed, and the timespan (the earliest event and the latest event).
Source panel
A source in Splunk refers to a unique name for the data you are searching. Keep in mind that there may be thousands of files making up a single Splunk source.
Source Types panel
A source type is Splunk’s grouping of events – this group of events may be made up of more than a single source and span many hosts.
The First Search
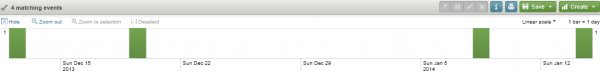
Let’s say I want to quickly identify the dates and times that the TM1 server was shutdown. To do that, I entered the word “closing” (not case sensitive) into the search bar and pressed enter. At that point, Splunk takes me to the results page.
The results page gives me a “match count” (the number of events (times) that the word “closing” appeared in the server log file) and then shows a graphical overview of the event distribution over a period of time.
FYI – there is a cool “zoom” feature that allows you to easily select sections of the timeline – Awesome!
The bottom section of the results page shows the actual data and is customizable. My page is showing the 4 occurrences (or events) of the search word that Splunk located in the file:
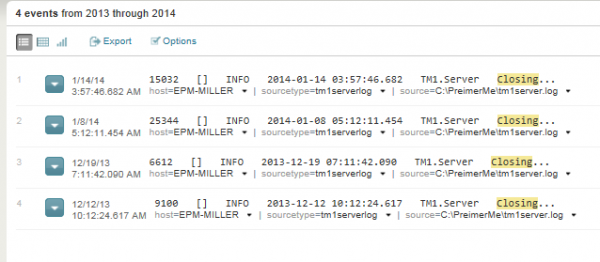
So, in seconds I see that the TM1 server was shut down 4 times – on the Dec 12 and 19th and on Jan 8 and 14 (the timestamps are also shown).
Conclusion
At this point you can begin to see the opportunity for leveraging Splunk with TM1. This search can be saved and shared, setup to run automatically and the output can be distributed to appropriate personnel. Dashboards can be built and so on. For the sake of the brevity of this blog post, I’ll stop here but you can be sure that over the next month or so I’ll dig deeper into some more complex examples of “Splunking TM1”.